Google Analytics or Adobe Analytics? For many marketers and analysts, this question stopped being rhetorical. That’s because we’re witnessing one of the biggest changes in the industry: Google shuts down Universal Analytics as it no longer meets measurement standards. Many companies have to adopt a substitution. And many of them need to do it yesterday.
Google offered a replacement for UA and provided two and a half years for marketers to get acquainted with and accustomed to the new Google Analytics 4 (GA4). However, the newcomer was met with mixed feelings. All of us are now weighing risks and considering tried-and-tested alternatives to Universal Analytics, such as, for example, Adobe Analytics. This brings us to a key question: Adobe Analytics vs. GA4 — how do they compare?
“Should our company buy Adobe Analytics or Google Analytics?”—if this dilemma bothers you these days, you’re at the right place. Let’s compare Google Analytics 4 and Adobe Analytics delving into the similarities and differences between the capabilities of both tools.
What is Adobe Analytics?
Adobe Analytics (AA) is an enterprise-grade analytics and reporting solution that is part of Adobe Experience Cloud. Originally developed by Omniture before being acquired by Adobe, Adobe Analytics collects real-time multichannel information about customers’ interactions with properties for in-depth reports. Businesses can use these reports to understand product success, user-brand interaction, conversion drivers, and more.
Adobe Analytics offers limitless ways to collect and use customer experience data. You can create different types of reports to get valuable insights. Using API integrations between Adobe Analytics and other Adobe and third-party solutions — content management, marketing automation, and experimentation software — you can activate your data in real time.
How does Adobe Analytics work?
Adobe Analytics collects data from websites, web and mobile apps, Adobe Experience Cloud applications, and third-party software (CRMs, DMPs, etc.). It uses JavaScript tags, APIs, server-side tracking, and SDKs to track various user interactions. You can track standard or custom events, which allows you to analyze every step of the customer journey.
The data is consolidated and stored on the Adobe Cloud infrastructure. The raw data is processed and organized into dimensions and metrics which are then reflected in your reports. By integrating the tool with Adobe Experience Platform, you can analyze data from the centralized progressive customer profile, which is built based on your customers’ interactions across all touchpoints of their customer journey.
With Adobe Analytics, you get freedom in slicing and dicing your data by creating custom reports tailored to your company’s needs. The tool offers a variety of visualization options, including charts, graphs, and tables, to present data in a compelling manner. You have access to complete and accurate data within the following feature limits:
| Feature Limits | Adobe Analytics |
|---|---|
| Unique values or data elements per report per month | 500,000 |
| Props per Report Suite | 75 |
| eVars per Report Suite | 200–250 |
| Events per Report Suite | 1000 |
| Processing Rules per Report Suite | 150 |
| Media Starts per month (Analytics for Streaming Media) | 1 million |
| Report Suite IDs (RSIDs) for Cross-Device Analytics | 3 per customer |
| Customer Attributes per Report Suite | 200 |
| Data retention | 25 months by default (or custom) |
Adobe Analytics prioritizes data protection and compliance by offering configurable data management options, user consent management, encryption for data transmission and storage, and access controls to safeguard user data. The platform allows you to customize data retention periods and anonymize or delete personally identifiable information to align with privacy policies.
Adobe Analytics Pros and Cons
When evaluating the suitability of Adobe Analytics for your analytics needs, you should consider a range of benefits and drawbacks of this solution.
| Adobe Analytics Advantages | Adobe Analytics Disadvantages |
|---|---|
| Adobe Analytics seamlessly integrates with other Adobe and 3-party products, enabling businesses to merge data from different sources and get comprehensive insights about cross-channel customer journeys. | The absence of a free-of-charge version restricts accessibility for small or budget-conscious businesses. |
| The tool has matured over time and has established itself as a reliable solution with robust capabilities. | The absence of accessible documentation and a testing account limits the ability to evaluate the tool before making a purchase. |
| The platform offers extensive customization options, empowering businesses to tailor their analytics implementation and reporting according to their specific requirements. | The implementation complexity necessitates the involvement of a technology consultant to ensure a successful setup and operation. |
What Is Google Analytics?
Google Analytics is a tool for tracking and reporting on user interactions with websites and mobile apps and is part of the Google Marketing Platform. When speaking about Google Analytics, we mean one of the four versions of this software existing in the market:
- Universal Analytics, the obsolete freemium version of the tool, that is discontinued on July 1, 2023.
- The UA properties under the payment plan of Analytics 360, which are also about to go away but get an additional year of support, until July 1, 2024.
- Google Analytics 4, the new analytics properties currently available as the default version in free-of-charge analytics accounts.
- Google Analytics 4, the new analytics properties under the payment plan of Analytics 360.
To make a fair comparison between Google’s and Adobe’s analytics tools, we’ll look at the capabilities and data collection and processing limits available in Google Analytics 4 properties under the Analytics 360 license.
How GA4 works
Google Analytics 4 collects data from websites and mobile apps via JavaScript code. Every time a user interacts with your property, the tracking code sends information about particular events to Google Analytics servers. Servers process, aggregate, and organize the collected data based on particular criteria and store it in Google’s cloud infrastructure. Data from the database then is fed into reports.
In GA4, you have quite a long list of automatically collected, enhanced, and recommended events that the analytics can track for you, for example, page views, page scrolls, link clicks, and video views. But if you want to track some events that are not on the list, you’ll need to use custom JS code and make sure you stay within the data collection limits:
| Feature | Google Analytics 4 properties under Analytics 360 |
|---|---|
| Event parameters | 100 per event. |
| User properties | 100 per property |
| Custom dimensions and metrics | 125 event-scoped custom dimensions per property 125 event-scoped custom metrics per property |
| Item-scoped custom dimensions | 25 per property |
| Conversions | 50 |
| Audiences | 400 |
| Explorations | 200 created per user per property and 1000 shared per property |
| Explore sampling limits | 1B events per query |
| Unsampled explorations | Unsampled results up to 50B events per day per property |
| API quotas | 250,000 tokens per day |
| Data retention | Optional: 2, 14, 26, 38, and 50 months |
| BigQuery Export | Billions of events for daily export, and unlimited streaming export |
| Events per User per day (for app data streams) | 2000 |
| Data import | Manual uploads: 120 uploads per day per property Storage limit: 1 TB per property |
The data collection process in GA4 is compliant with regional privacy regulations. You can turn on and off particular data collection features on a per-region basis. For example, to comply with the EU regulations GA4 by default doesn’t log or store IP addresses for the traffic from the EU. Additionally, you can disable the collection of granular location data derived from the IPs
GA4 Pros and Cons
There have been numerous discussions regarding the interface and capabilities of the new Google Analytics4. Much of the frustration stems from its significant departure from the previous version that users are accustomed to. However, to maintain objectivity, it is important to set aside personal sentiments and focus on the facts.
| GA4 Advantages | GA4 Disadvantages |
|---|---|
| Event-based tracking simplifies data collection while providing valuable insights into user interactions with your property. | The new software does not yet encompass all the features that were planned.. |
| A balance between standard reports and custom explorations enables you to present your data according to your preferences. | The interface continues to evolve and frequently changes as Google introduces and reevaluates features. |
| Documentation, video tutorials, and free test accounts are readily accessible to help you become acquainted with the tool before making a purchasing decision. | The documentation for GA4 may undergo changes and occasionally be outdated, resulting in incomplete coverage of all the features of the new solution. |
Why Use an Enterprise-Level Analytics Platform?
Enterprise-grade analytics tools cost a lot but they are worth the money. Mostly it’s for the volume of data they process and for the service level agreements that allow your company to keep software vendors accountable. If your company has high expectations from the analytics software, you have to use paid solutions to:
- Analyze your data and get actionable in-depth insights in real time.
- Customize and deeply integrate the tool into your software ecosystem.
- Break down data silos and democratize data across departments.
- Capture custom events, and track and calculate business-specific metrics.
- Have access to the full amount of raw data to double-check any insight.
- Have access to historical data to see trends and make strategic decisions.
- Ensure rock-solid data security and compliance.
Adobe Analytics vs Google Analytics 360
While both platforms offer powerful features, each has its strengths and nuances that set them apart in terms of data collection, analysis capabilities, and integration possibilities. Let’s compare the most important capabilities of both platforms.
Integration into a marketing ecosystem
Both Adobe and Google made their analytics software a part of a robust set of marketing solutions—Adobe Experience Cloud and Google Marketing Platform. Integrations between these tools allow you to consolidate data collected from different sources and use insights to improve various aspects of the business. Let’s compare the scope of both ecosystems.
| Solutions/Ecosystems. | Adobe Experience Cloud | Google Marketing Cloud |
| Content management | Adobe Experience Manager | — |
| Additional analytics, audience management, segmentation | Adobe Customer Journey Analytics, Real-Time CDP, Adobe Audience Manager | — |
| Ecommerce platform | Adobe Commerce | — |
| Data visualization | Adobe Analytics Workspace | Looker Studio |
| Experimentation and personalization | Adobe Target | Google Optimize (shut down after Sept 30, 2023) |
| Advertising | Adobe Advertising | Search Ads 360, Display & Video 360 |
| Multichannel marketing automation | Marketo Engage, Adobe Campaign | Campaign Manager 360 |
| Tag management | Tags (former Adobe Launch, now part of Adobe Experience Platform) | Google Tag Manager |
| Data warehouses, data lakes | Adobe Experience Platform, Adobe Data Workbench | BigQuery |
| Project management | Adobe Workfront | — |
As you can see, Adobe Analytics is part of a much wider ecosystem that offers more opportunities for native integrations between tools and building efficient data flows.
GA4 vs. Adobe Analytics Interface
After the release of GA4, Google’s analytics tool underwent a significant transformation. The new interface bears resemblances to Adobe Analytics Workspace. Despite the overall similarities, the user experience in the two tools remains distinct.
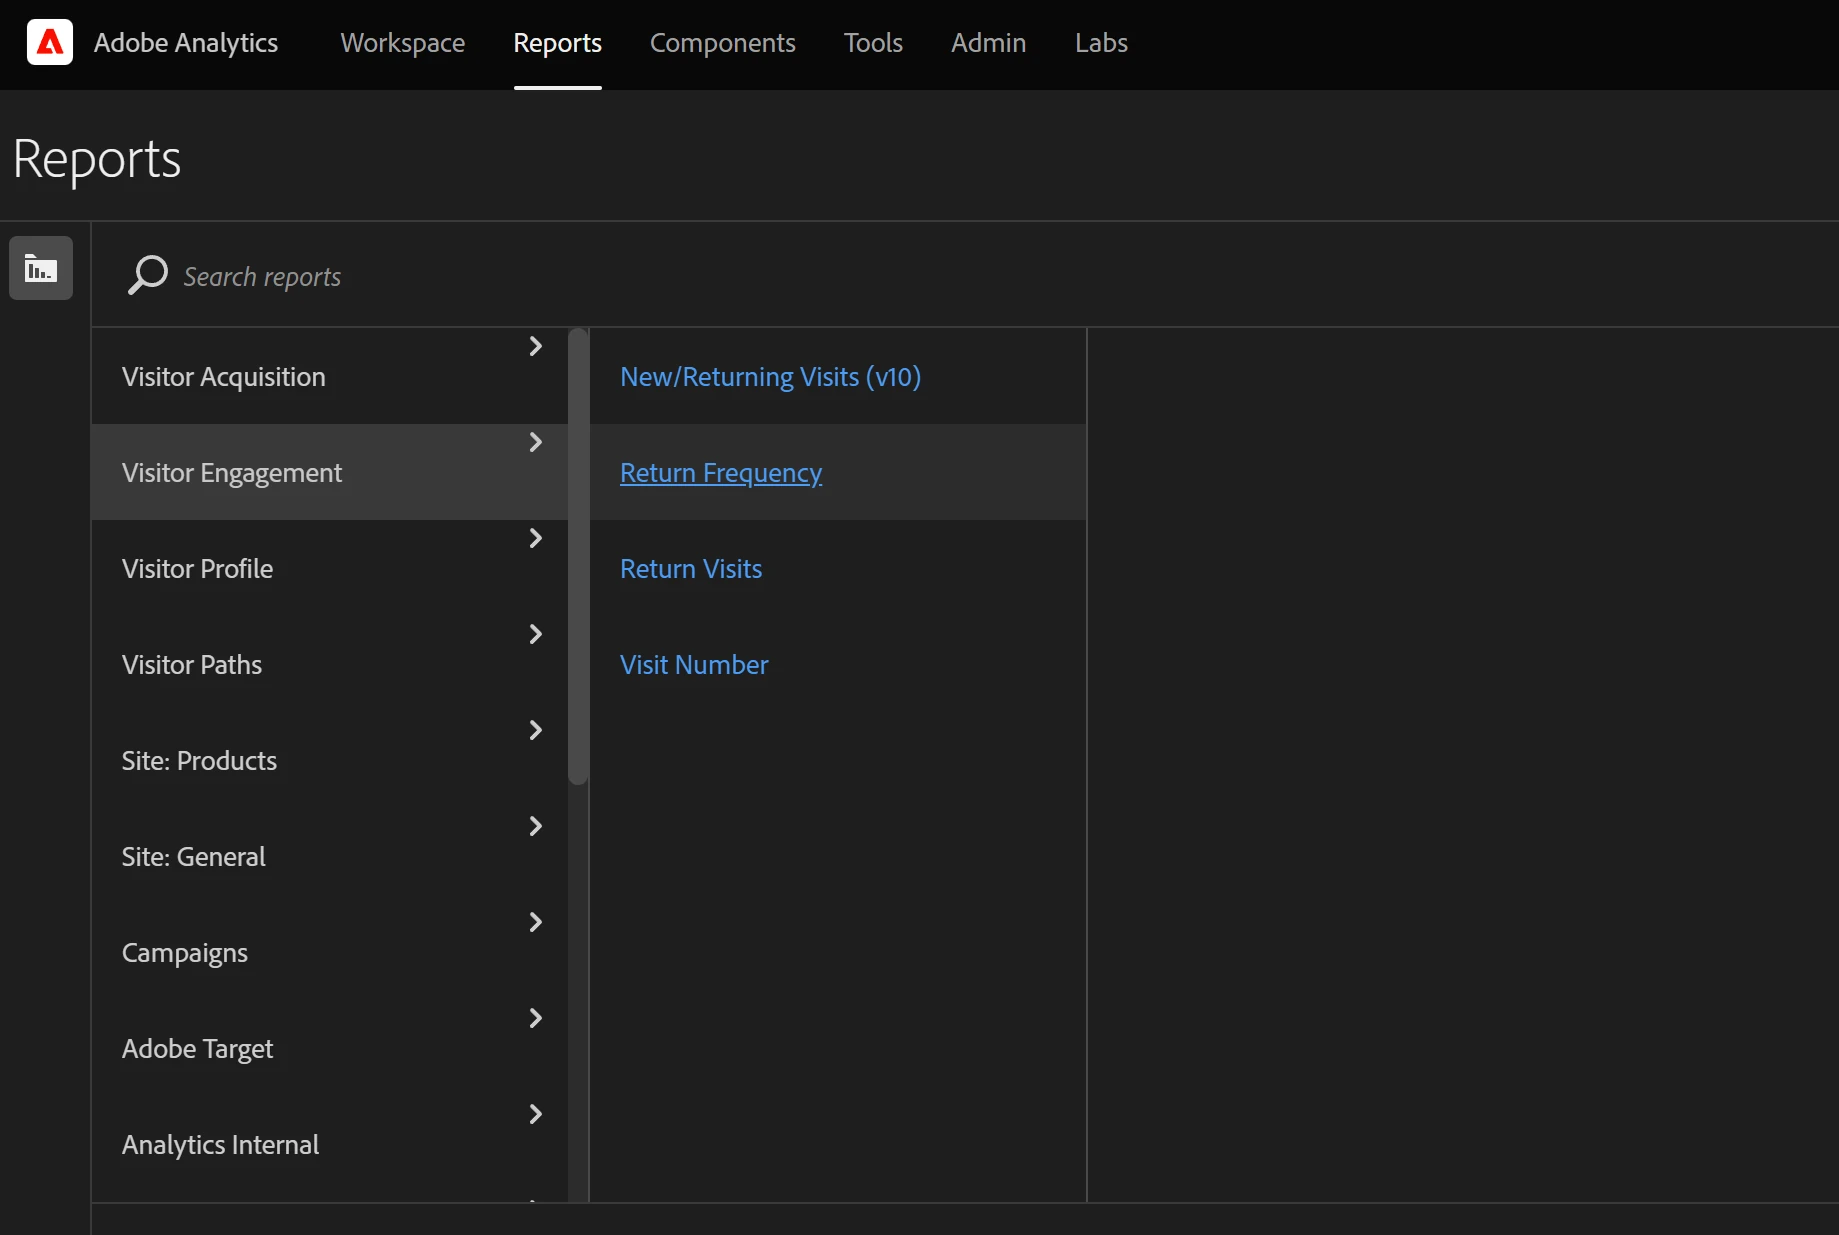
Let’s look at the Adobe Analytics interface first. On the sidebar, Adobe Analysis Workspace has three main tabs:
- Projects, where you find a list of all your analysis workspace projects.
- Reports, where you can access a collection of pre-built reports.
- Learning, where Adobe offers you a set of product tours and tutorials.
In the top menu of the Adobe Analysis Workspace, you can navigate to:
- Components, where you can work with segments, calculated metrics, annotations, etc.
- Tools, like Data Workbench, Report Builder, Data Warehouse, Mobile Services, etc.
- Admin, where you can manage your Report Suites, Users, Data Feeds, etc.
You can create new analytics projects following templates or start from a blank page and save them to your list. When creating a report you use a convenient drag-and-drop interface and free-form environment that allows you to select dimensions, values, and ways of visualization to get reports tailored to your needs.

As a result, you get a convenient suite of interactive dashboards comprehensively covering particular aspects of your business.
As for the Google Analytics interface, it now has a simpler design than the old Universal Analytics. From the navigation pane, you can access several workspaces:
- Home, showing the dashboard with shortcuts to Recently Accessed and Suggested reports, Insights & Recommendations.
- Reports, with the Snapshot Report, Real-time Report, and groups of pre-built interactive reports related to customer Life Cycle, User demographics and Tech.
- Explorations, where you can find a drag-and-drop custom report builder somewhat similar to what Adobe Analytics Workspace offers.
- Advertising, where you can analyze data from your Google Ads account.
- Admin, from where you can access User and Property settings.
From the top menu, you can navigate between different analytics accounts and integrated tools, such as Tag Manager, Surveys, Optimize (discontinues on September 30, 2023), etc.
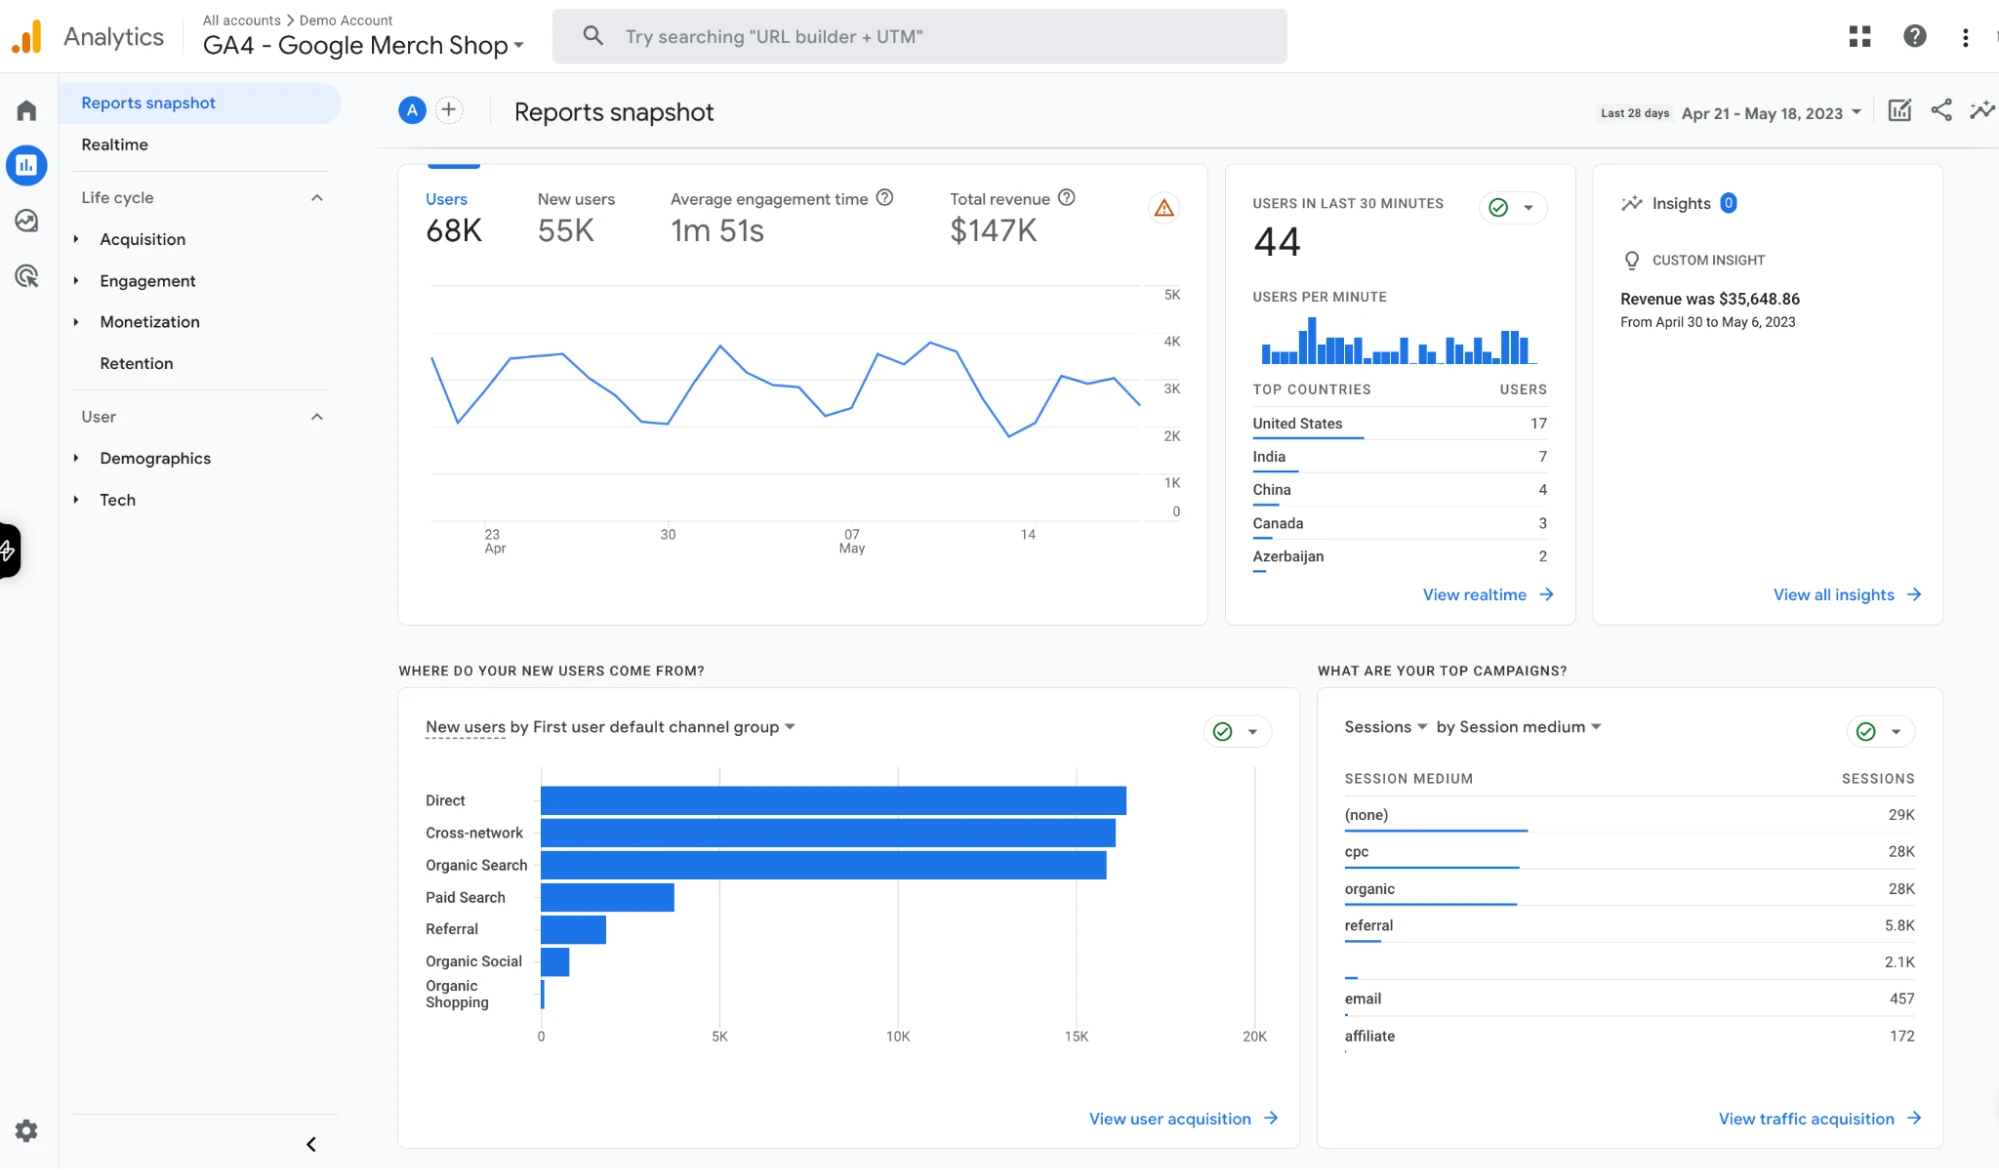
The GA4 interface provides users with a modern and streamlined experience for analyzing and understanding their website or app data. It offers a simplified navigation structure, intuitive data visualization, and enhanced custom reporting capabilities.
Report customization options
One of the key benefits of Google Analytics and Adobe Analytics is the ability to customize the user interface with a wide range of features. By customizing the tool appropriately, you can effectively address your specific needs and overcome critical business challenges.
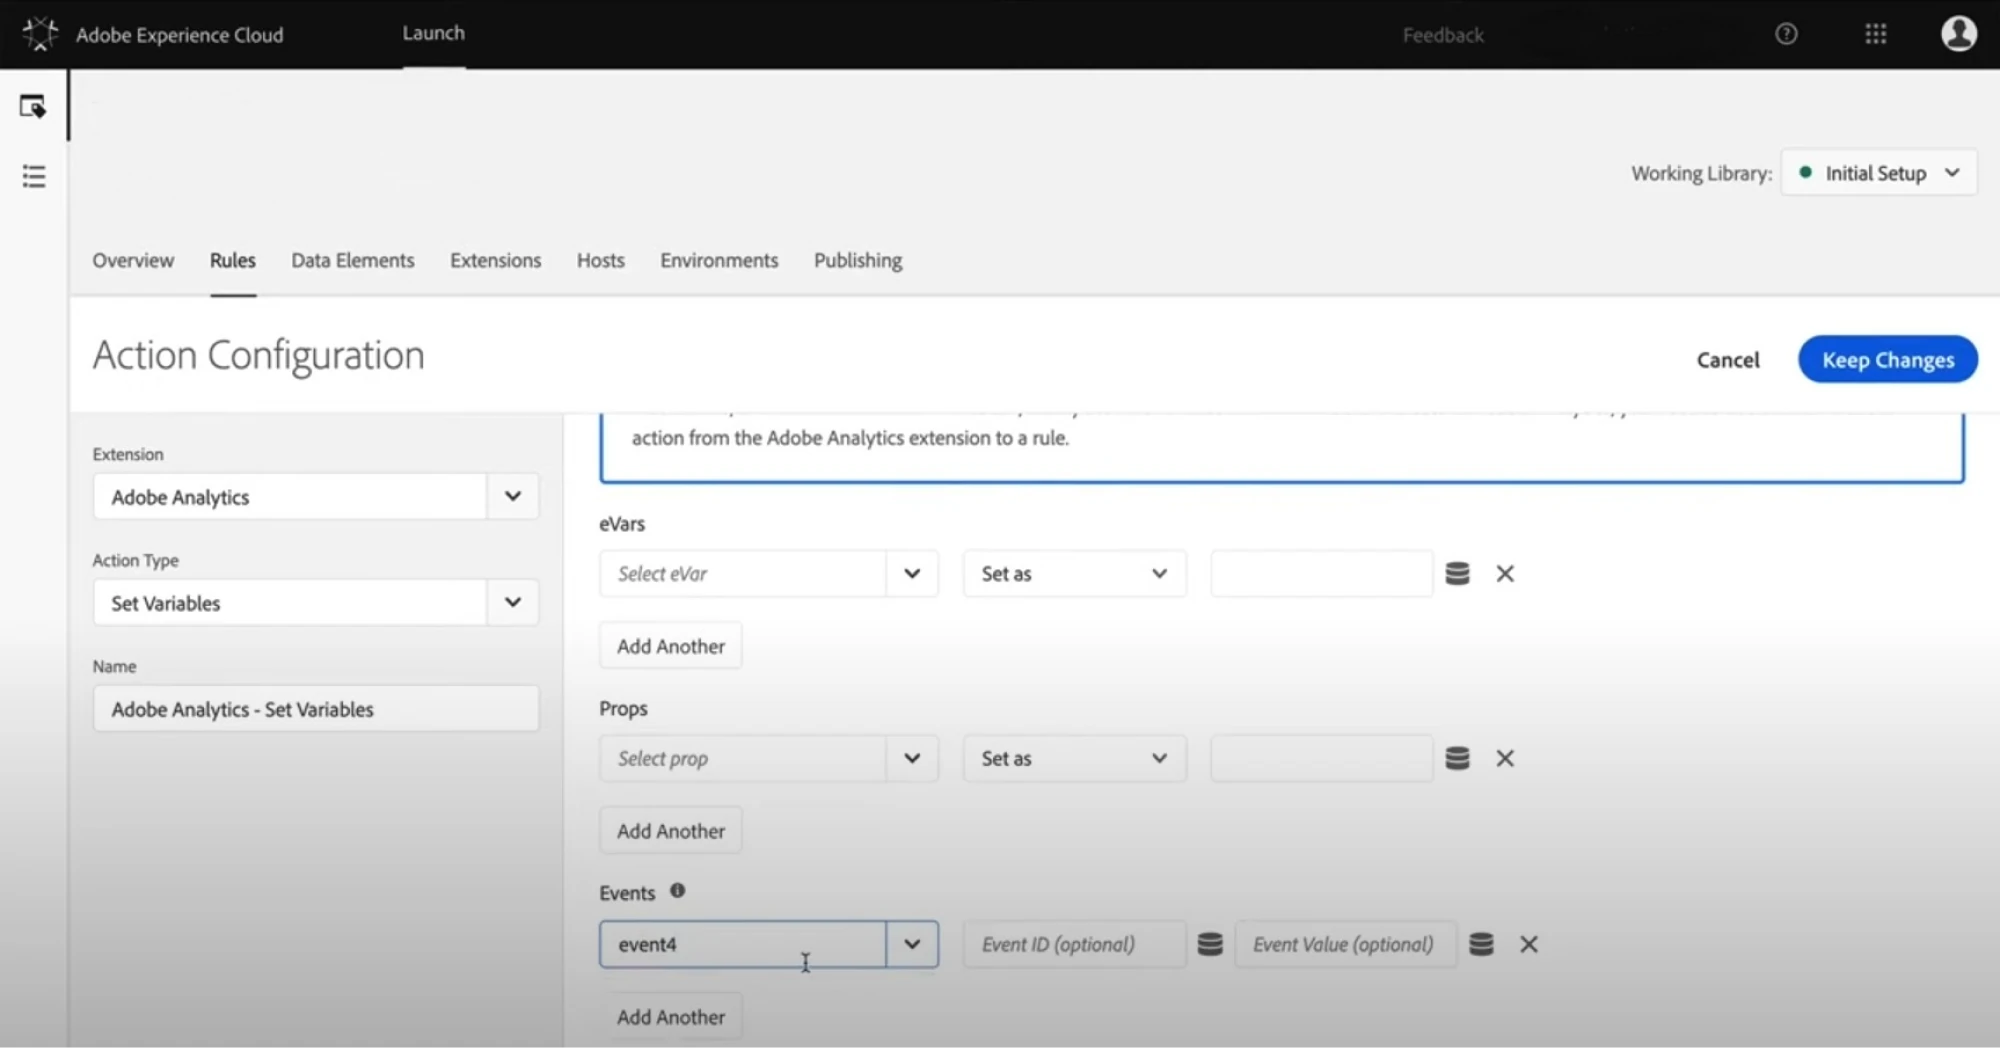
Adobe Analytics was originally designed with a strong emphasis on customization, offering remarkable flexibility and extensive opportunities for customization.
To ensure accurate data capture, effective conversion tracking, and comprehensive classification systems, Adobe Analytics utilizes eVars (conversion variables), events (success events), and props (traffic variables).
In addition, Adobe Analytics can efficiently process and export data at a large scale through Adobe Data Workbench, which serves as Adobe’s version of BigQuery. Data Workbench offers highly flexible and powerful multi-channel capabilities specifically designed to collect, process, analyze, and visualize data from both online and offline customers.
Google Analytics offers the ability to expand data collection through Custom Dimensions and Custom Metrics. Subsequently, this data can be exported to BigQuery and visualized using Looker Studio (former Google Data Studio).
Ease of implementation
Without access to experienced consultants, implementing Adobe Analytics can be challenging. Effective planning, customization, and management of the implementation process require engaging an experienced specialist with a clear vision.
Nevertheless, thanks to the highly personalized implementation and extensive customization opportunities, the data you obtain from Adobe Analytics will offer deeper insights and be better tailored to your specific business requirements compared to what you would get from GA4.
Additionally, you can use Tags (Adobe Launch) for simplified tag deployment and management, eliminating the need for specialized developer expertise.
Implementing GA4 is more straightforward as it does not require programming skills. To add the GA4 tracking script, you simply need to copy it from the GA4 interface and paste into your property.
To gather more accurate data, you can make necessary adjustments to filters, conversion goals, custom dimensions, and more, all without developer involvement. However, relying solely on GA4 out-of-the-box features may retain you from maximizing the value of your data analytics.
Pathing analysis
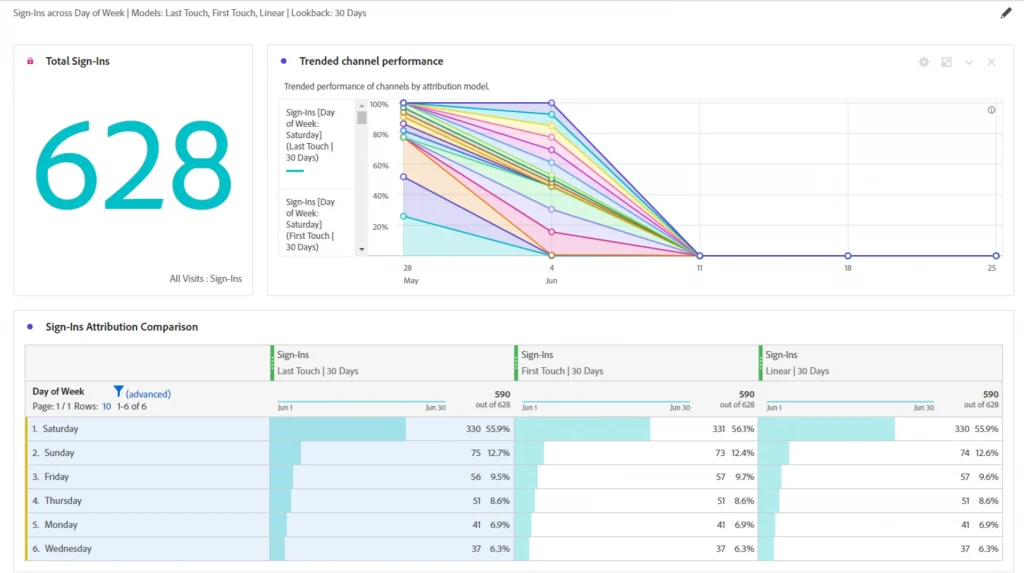
Adobe Analytics offers pathing reports that are both insightful and highly customizable. The Path Finder Tool helps you analyze entry points, exits, and the content viewed along a user’s path. With this tool, you can select any event or page and generate a report showing the actions users took before and after that particular point. The pathing analysis is commonly used to gain an understanding of the various routes visitors take from Page A to Page Z on your website.
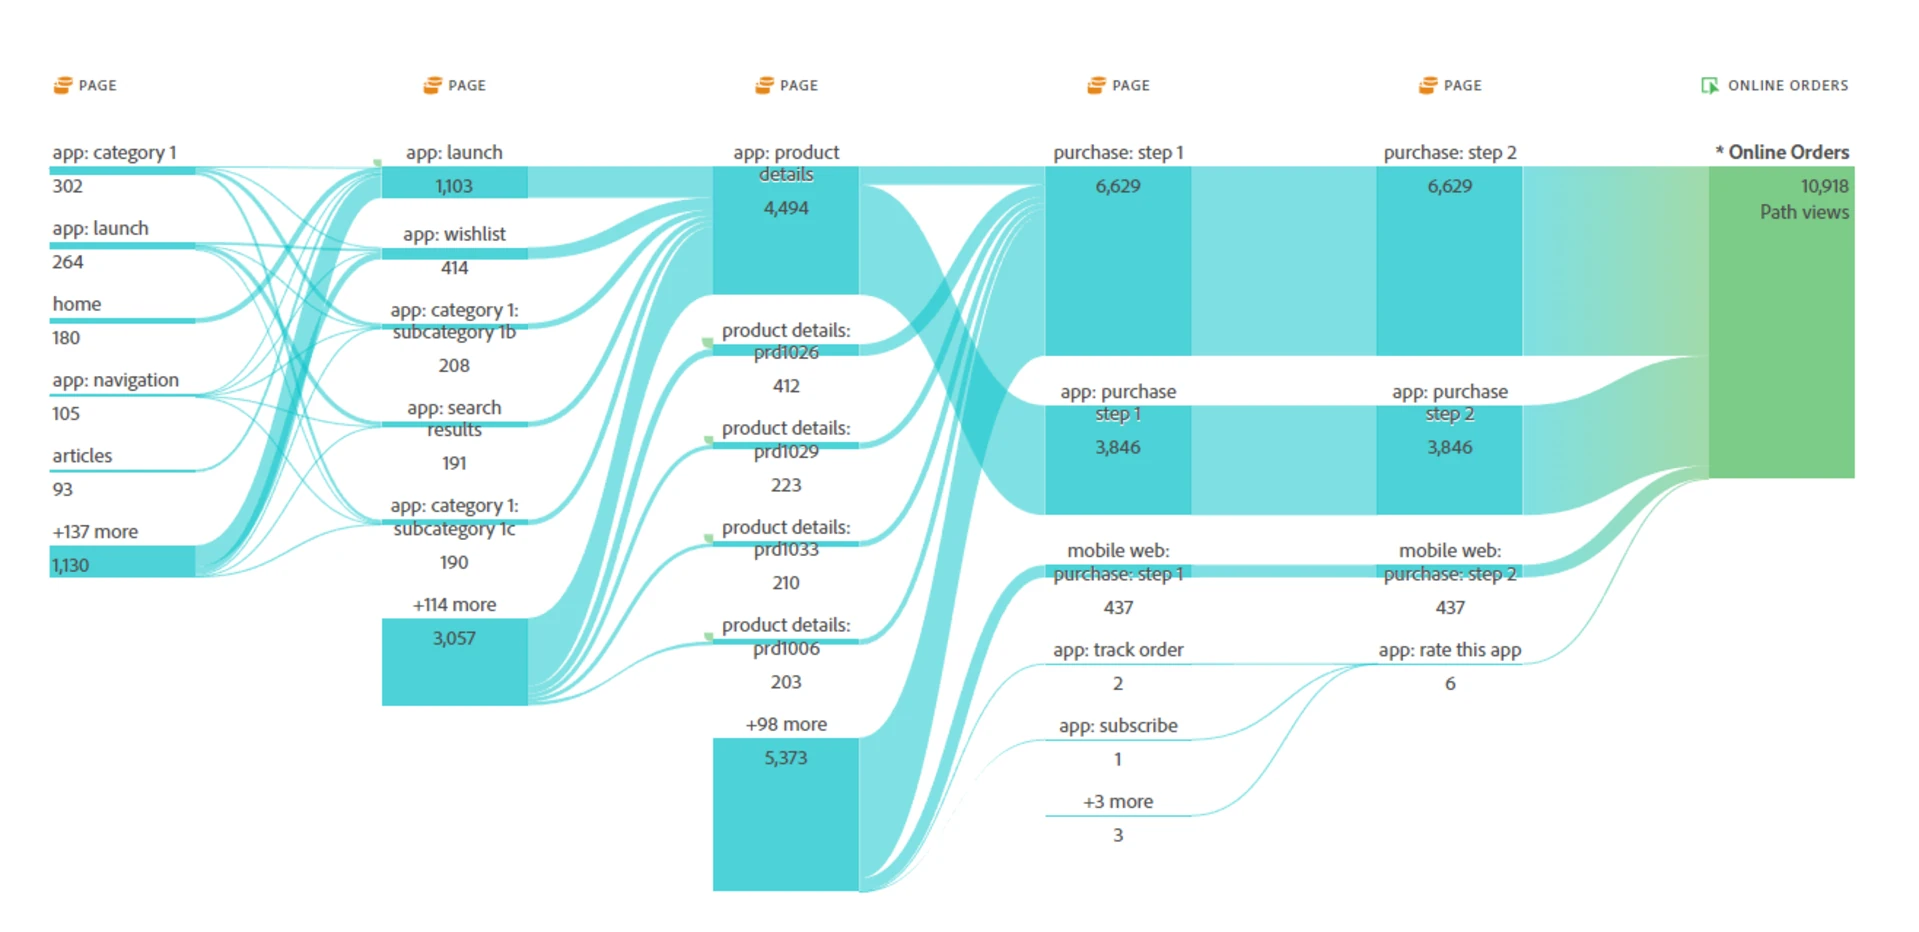
In the new interface of GA4, you can now create similar reports by using the Path Exploration template available under Explorations. This custom report enables you to analyze user paths and explore the sequence of events or pages visited by your website visitors. Using this feature, you can gain insights into patterns or trends in users’ interactions with your properties.
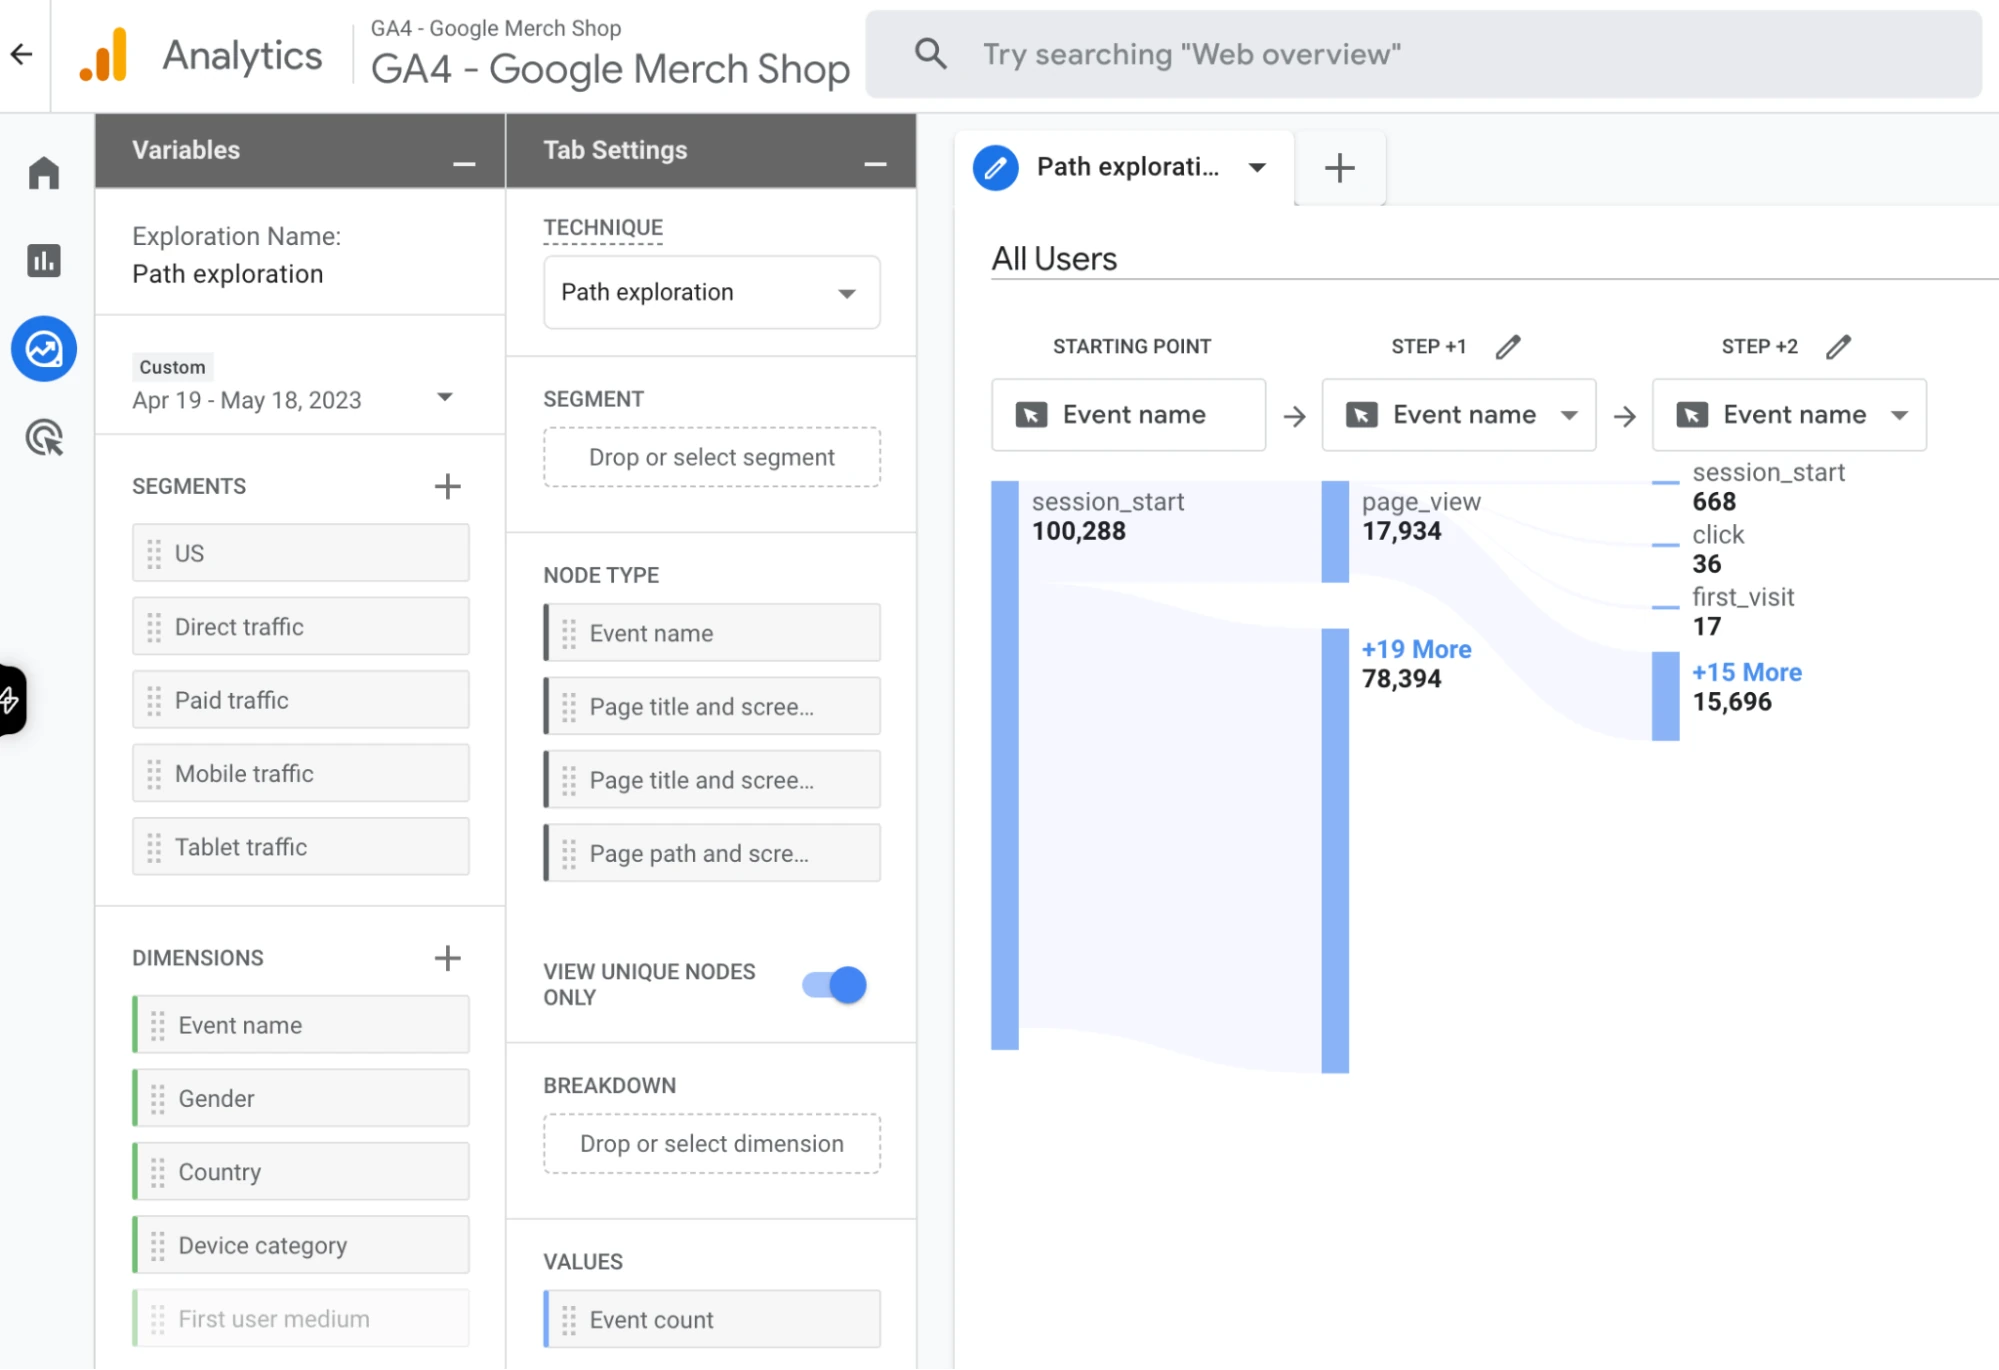
The addition of pathing reports similar to those found in Adobe Analytics is one of the most notable improvements in the GA4 interface compared to the previous Universal Analytics.
Predictive analytics
Predictive capabilities utilize machine learning to automatically analyze vast amounts of data, uncovering patterns that may go unnoticed due to the time and capacity constraints of manual data analysis.
In Adobe Analytics, you can leverage Adobe Sensei for your company to harness the benefits of big data on an unprecedented level.
For example, contribution analysis helps businesses unveil concealed patterns within their data that elucidate statistical irregularities and reveal correlations behind unforeseen customer behaviors, abnormal data points, and sudden fluctuations in metrics among different audience segments.
This analytical approach helps organizations understand the underlying factors driving unexpected trends and empowers them to make informed decisions based on these insights.
In GA4 you can measure several predictive metrics: Predicted Revenue, Purchase Probability, and Churn Probability if certain types of events are being tracked on your properties. You can use these metrics in the Audience Builder and custom reports under Explorations.
AI-based alerts in analytics
Adobe Analytics and Google Analytics 4 (GA4) both offer AI-powered alerts, but they function somewhat differently. Anomaly detection involves the automatic identification of significant deviations in your data through statistical modeling.
In GA4, the AI alerts, known as anomaly detection, help users to identify significant changes in data patterns across their reports, such as spikes in traffic or drops in conversion rates. It’s designed to flag unexpected events without prior setup by the user.
Adobe Analytics takes it a step further with its intelligent alerts powered by Adobe Sensei. These alerts not only detect anomalies but also suggest possible root causes.

Adobe’s alerts are considered ‘smarter’ than those in GA4. They take into account historical data and trends, which makes them more predictive, nuanced, and context-aware.
AI-based audience segmentation
For example, it can distinguish segments based on nuanced browsing habits, time spent on different content, and the propensity to convert. This automated segmentation helps marketers quickly understand and target specific audience niches without manually sifting through data.
When it comes to ecommerce analytics, both Google Analytics and Adobe Analytics offer robust capabilities, but with different approaches. Google Analytics, particularly GA4, provides event-based tracking, automated insights, and deep integration with Google Ads. Adobe Analytics, on the other hand, excels in advanced segmentation, customer journey analysis, and real-time data activation, making it a powerful choice for enterprises that require deeper insights and personalized marketing strategies.
For Ecommerce, both platforms support Server-Side Tracking, Mobile Analytics, and App Tracking. Adobe Analytics enables server-side forwarding, reducing client-side load and improving data accuracy across channels. Google Tag Manager’s server-side tracking enhances data security and control over event processing. In mobile and app tracking, Google Analytics offers Firebase integration for streamlined app analytics, while Adobe provides a dedicated Mobile SDK, allowing deeper customization and cross-device tracking.
Additional data visualization tools

Adobe Report Builder is a convenient extension or plug-in for Microsoft Excel that enables you to create reports directly within the familiar Excel interface. This means you can leverage your existing knowledge and skills in Excel without the need to learn additional data interfaces.
With Adobe Report Builder, you can easily access and manipulate data from Adobe Analytics within Excel, allowing you to analyze and visualize the data in a way that suits your needs. It provides a seamless integration between Adobe Analytics and Excel, making it a user-friendly and efficient tool for generating reports.
When it comes to data visualization for GA4, Looker Studio is a powerful tool that offers additional capabilities. It allows you to connect to various data sources, including GA4, and create interactive and visually appealing dashboards, reports, and charts.
Ad-hoc reports
Adobe Ad Hoc Analysis is indeed a remarkable feature that offers advanced reporting capabilities, enabling business users to explore data in real time. With Ad Hoc Analysis, users can quickly dive into their data and gain valuable insights without the need for complex queries or programming skills.
Ad Hoc Analysis also offers advanced features such as segmentation, filtering, and drill-down capabilities, allowing users to slice and dice data to uncover trends, patterns, and correlations. The real-time nature of the tool ensures that users can instantly interact with their data and make data-driven decisions on the fly.
Additionally, Ad Hoc Analysis provides flexible export options, allowing users to save and share their reports in various formats such as Excel, PDF, or CSV. This facilitates collaboration and enables stakeholders to access and review the insights generated through the tool.
Cross-channel data collection
Deploying Adobe Analytics to websites and mobile apps is made easier with Tags (Adobe Launch), which provides a streamlined process for implementing tracking codes. In addition, Adobe offers a variety of APIs that allow for custom integrations and extended functionalities.
For server-side deployments, ready-made libraries are available for popular programming languages such as Java, .NET, and PHP. These libraries simplify the implementation process and enable seamless communication between your server and Adobe Analytics. Furthermore, Adobe provides pre-built modules specifically designed for tracking video and audio streams, ensuring accurate measurement and analysis of multimedia content.
Adobe Analytics APIs provide the flexibility to deploy your solutions on a wide range of devices with internet access, including kiosks, wearables, and IoT devices. This allows you to extend your analytics capabilities beyond traditional web and mobile platforms. Additionally, you can import data from offline customer interactions to enhance and enrich the data collected online
In GA4, you have the capability to collect data from both websites and mobile applications. By setting up data streams, you can create properties that consolidate data from both the app and site or separately capture data from each touchpoint.
Measuring e-commerce metrics
In Adobe Analytics, e-commerce data doesn’t live in a silo. You can collect and analyze product-related data and transactional data the same way as any other data. You can leverage “Merchandising” eVars to build reports on product metrics. Using Adobe Analytics, you can:
- Transform search terms into merchandising variables and associate purchases and revenue with them.
- Standardize all e-commerce metrics per visit.
- Evaluate the performance of products, categories, and brands based on their ability to convert traffic into revenue.
- Utilize as many product-specific custom dimensions as necessary.
These and numerous other analyses that can be effortlessly conducted in Adobe Analytics would demand a significant amount of effort or be unachievable with other analytics tools.
In GA4, e-commerce events aren’t tracked automatically. To see e-commerce data in analytics, you should manually add the required events to the Google Tag Manager container. These can be: ‘add to cart’, ‘purchase’, ‘refund’, and many more pre-built events for online sales and mobile games.
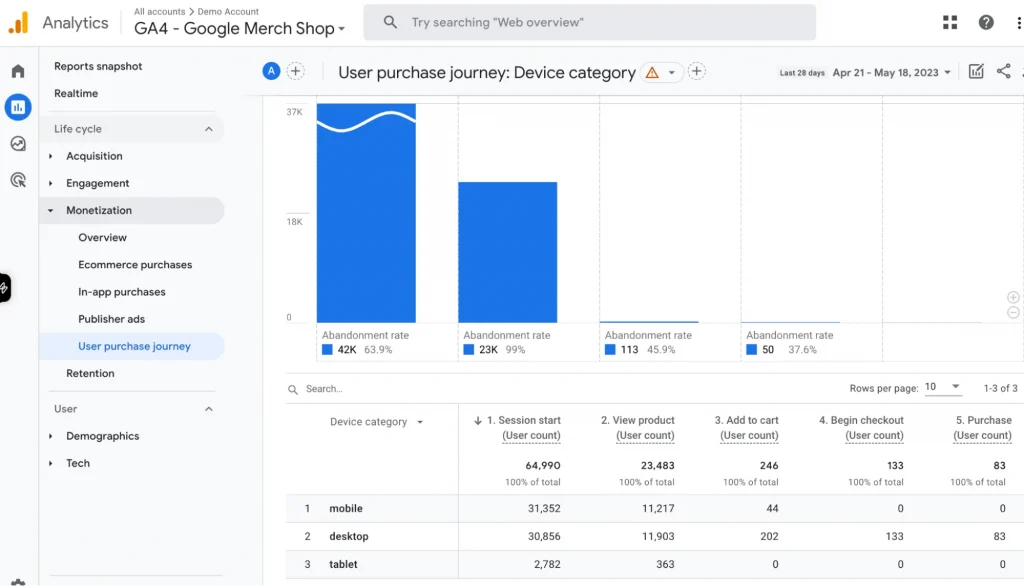
The Ecommerce purchases and Monetization overview reports surface e-commerce information automatically. To make custom reports on your e-commerce data, you can use Explorations and build, for example, checkout funnel performance or promotion performance reports.
Analytics tools pricing plans
The key difference between Adobe’s and Google’s analytics solutions is the availability of a free-of-charge subscription.
Google offers a free-of-charge version of the tool. Yet, it has data collection limits that don’t cover the needs of companies owning high-traffic digital properties. Companies using Google Analytics 360 pay about $150k+ per year for the license.
Adobe Analytics doesn’t have a free subscription. The subscription price varies between $30,000 and $350,000+ per year. The actual spending depends on how many user interactions with your digital properties your analytics tracks.
Market share among analysis tools
As of November 2023, Google Analytics dominates the market. According to W3Techs, 54.6% of all websites use it, which translates to an 84.7% share among traffic analysis tools. The significant market presence of Google Analytics 4 can be largely attributed to its free version.
Adobe Analytics, conversely, does not offer a free tier, positioning itself as a premium, enterprise-level solution. It has a smaller overall market share, at just 0.2%. It’s mainly used on larger, high-traffic websites. In the top 1,000 websites, its usage jumps to 5.2%.
On the BuiltWith, you can find the following stats on the usage of Adobe Analytics by businesses from different countries.
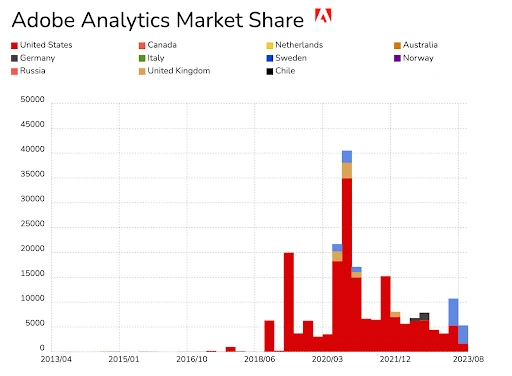
These figures illustrate a trend: GA4 is widespread across the board, while Adobe Analytics is preferred by large, enterprise-level companies, where the budget and need for advanced analytics justify the investment in a paid analytics solution.
Adobe Analytics or Google Analytics 360: Which Tool Is Best for Your Business?
There is no definitive winner in this case. The decision depends on your business goals, budget, and available expertise.
If you require an analytical tool primarily for marketing goals, Google Analytics will suffice. However, if you seek in-depth insights and AI-driven reports to delve into user journeys and personalize them, Adobe Analytics stands as the unparalleled choice.
If your business ecosystem already includes other Google Marketing Platform products GA4 you may consider staying with GA4. If you use Adobe products, such as Adobe Experience Manager or Adobe Target, Adobe Analytics is the most advantageous choice for you.
Although GA4 and Adobe Analytics share many similarities, it is worth emphasizing the unique features of Adobe Analytics that have a profound positive impact on businesses.
- Analysis Workspace provides the best interface available in any analytics tool today, enabling intuitive and efficient data analysis.
- Enhanced Data Model: Adobe Analytics offers a superior data model, allowing limitless segmentation and post hoc enrichment of data, providing more comprehensive insights.
- Expanded Dimensions and Metrics allow companies to have greater flexibility in capturing and analyzing the data that matters most to their business.
- Adobe Analytics integrates seamlessly with the Adobe ecosystem, leveraging AI-powered capabilities to deliver advanced analytics and insights.
- Adobe Analytics offers unparalleled extensibility and customization options, allowing businesses to tailor the tool to their specific needs and integrate it into their existing workflows.
- Adobe Analytics enables a comprehensive view of the customer journey, allowing businesses to understand and optimize every touchpoint along the way.
These unique features make Adobe Analytics a powerful and comprehensive analytics solution for businesses.
If You’re Considering Adobe Analytics…
In the Adobe-vs-Google battles, marketers and analysts tend to gravitate towards the tools they are familiar with and subsequently find reasons to support their choice for various use cases. Although we lean towards Adobe, we have made a concerted effort to provide a fair comparison of the tools, enabling you to assess the pros and cons in order to make an informed decision.
If you believe that Adobe Analytics is the best fit for your needs, we are here to support you every step of the way. Axamit has a proven track record of integrating Adobe Analytics into clients’ projects. Adobe Analytics implementation typically encompasses a combination of out-of-the-box capabilities and tailored customizations to meet specific requirements.
To generate comprehensive reports, we write data collection scripts for AEM, Target, and Marketo. This approach allows us to populate clients’ Adobe Analytics databases with detailed information related to products and customer-brand interactions.
Feel free to reach out to us with any inquiries you may have about the Adobe Analytics implementation. We can thoroughly analyze your pain points and deliver meticulous recommendations for an optimal custom-designed solution that aligns seamlessly with the unique requirements of your business.
Which is better: Adobe Analytics or Google Analytics?
Adobe Analytics vs. GA4 is a key consideration for businesses evaluating their data measurement needs. Adobe Analytics tends to be preferred by larger organizations due to its mature and reliable platform, as well as its extensive customization options. On the other hand, Google Analytics offers a user-friendly interface and is often favored by small to mid-sized businesses. Ultimately, the decision should be based on factors such as budget, technical expertise, and the desired level of customization.
What is the difference between Google Analytics sessions and Adobe Analytics visits?
In Google Analytics, a session represents a period of time during which a user interacts with your website or app. It starts when a user opens a page/app and ends after 30 minutes of user inactivity. In Adobe Analytics, a visit refers to a series of interactions by a visitor on a website within a specified timeframe. It starts when a user opens a page/app and ends after 30 minutes of user inactivity, 12 hours of activity, over 2500 hits generated overall, or over 100 hits generated in 100 seconds (automatically considered to be a bot).