Without data, there is no marketing. That might seem like a bold statement, but think about it—when was the last time you ran a marketing campaign where no one asked you for data on how it did?
Marketers are constantly sifting through oceans of data to make inferences about what happened and justify what to do next. And when data is your bread and butter, you can’t settle for a partial view of what customers are doing.
With Adobe Analytics, you’ll never have to concede to look at just one piece of the whole pie. Adobe data analytics gives you the full-funnel, cross-channel, cross-device power you need to build data visualizations that inspire action. Curious how it works its magic? Let’s dive in!
What is Adobe Analytics?
Simply put, Adobe Analytics (AA) is a data collection and analysis platform that provides comprehensive insights into how your customers interact with your brand.
Now, that’s all well and good, but what is an analytics platform, anyway? An analytics platform directly collects and aggregates data from multiple sources to provide actionable insights about how your customers interact with your business.
AA is known for its highly intuitive data insights, but also its incredible integrations. It can be linked with many other Adobe Experience Cloud products you may already be using, like Adobe Experience Manager (AEM), Adobe Target, or Adobe Commerce Intelligence (formerly Magento Business Intelligence).
On top of that, it also features 200+ integrations with third-party software like BrightEdge and Hootsuite.
The Origins of Adobe Analytics
Some of you may remember Adobe Analytics once bearing a different name, and that begs the question: What is Omniture? Looking back, Adobe Analytics started as Adobe Omniture—a standalone web analytics platform that Adobe acquired in 2009.
Omniture continued to operate under its original business name within the Adobe umbrella until 2012 when Adobe fully integrated it into its suite of products. These days, Adobe Analytics tools exist within the overarching Adobe Experience Cloud.
What is the Adobe Analytics Cloud?
Adobe Analytics is the heart of the so-called Adobe Analytics Cloud, a whole set of tools that allow your company to analyze customers’ journeys with unprecedented granularity.
You can either use Adobe Analytics on its own or extend its capabilities with additional members of the Adobe cloud analytics family, such as Customer Journey Analytics and RT-CDP.
What is Adobe Analytics Used For?
While there’s plenty of competition out there, the Adobe Analytics suite specializes in a few key things that other platforms fall short in:
- Easy-to-use, highly interactive data dashboards.
- Dynamic, easily accessible AI-enabled features like real-time anomaly detection.
- Expanded Adobe digital analytics from sources like OTT, IoT, voice, and more.
- Quick and simple insight-to-action thanks to robust platform integrations.
Most importantly, Adobe Analytics data isn’t siloed into one channel—rather, it allows you to gather, combine, and report on data from your very first touch points to your very last, even if those touch points happen offline.
Wondering what sorcery allows AA to know what your customers are doing offline? Well, it’s not magic. Rather, its expansive platform integrations and offline data upload features make this possible.
How Does Adobe Analytics Work?
To start, Analytics by Adobe can draw data from a long list of online sources in real time, meaning the data you’re viewing is always the most current snapshot.
Some of these online sources come from direct integrations with AA to bring data into the platform. Other online sources, like your website or app, require an Adobe tracking code installed to bring data through.
Adobe Analytics also enables you to integrate with platforms that contain offline data or upload offline data yourself, to complete your customer journey in your reporting.
Once your data is flowing into Adobe Analytics from your desired sources, you can mix and match it in a variety of visualizations. You can also segment your data however you like, view data trends over time, and more.
While this may seem highly technical, detailed AA reports are actually highly accessible for anyone to build. Whether you’re a data guru looking to create advanced custom breakdowns, or a marketer simply looking for actionable insights, AA has the power and the plug-and-play ability to make both possible.
Adobe Analytics Packages
Now, we know that each business’ analytics needs vary quite a lot. Some of you may be testing the waters—others might need the most expansive list of features an analytics platform can offer. To meet these varying needs, Adobe offers a few different packages.
Each AA package has many of the same robust features, but here’s a snapshot of all the ways each one differs:
| Analytics Select | Analytics Prime | Analytics Ultimate | |
|---|---|---|---|
| Segment comparison? | No | Yes | Yes |
| Cross-device analysis? | No | No | Yes |
| Custom dimensions? | 275 max | 275 max | 325 max |
| Retroactive data reprocessing? | No | No | Yes |
| Field-based identity stitching? | No | No | Yes |
| Customer attributes? | 3 max | 15 max | 200 max per report suite |
| Data repair API? | No | No | Yes |
| Segment IQ? | No | Yes | Yes |
| Anomaly detection? | Limited | Yes | Yes |
| Contribution analysis? | No | 10 tokens per month | 20 tokens per month |
| Intelligent alerts? | No | Yes | Yes |
| Algorithmic attribution? | No | No | Yes |
| Report builder? | 5 seats max | Unlimited seats | Unlimited seats |
Adobe Analytics Overview of Features
By far, what makes Adobe Analytics superior to alternative options is its wealth of features. No matter what kinds of data you’re bringing in or from where, Adobe Analytics products give you the power to mix, match, compare, and combine your insights in unique ways.
While the full list of Adobe Analytics features is much longer, for our purposes we’ll cover just a few of the biggest hitters for businesses.
Multi-Channel Data Collection
Typically, the best customer insights don’t come from just one place. To understand your customers on a deeper level and appeal to them in more engaging ways, you’ve got to see the big picture.
As we touched on a bit earlier, the Adobe Analytics platform gives you the power to collect data from an expansive variety of online sources, including:
- Your website
- Email campaigns
- Digital advertising campaigns
- Web-connected kiosks
- Apps
- Client-server applications
- Mobile devices
On top of that, you can also upload any offline data that is important for understanding your customers’ paths, and view and report on it in conjunction with your coffers of online data.
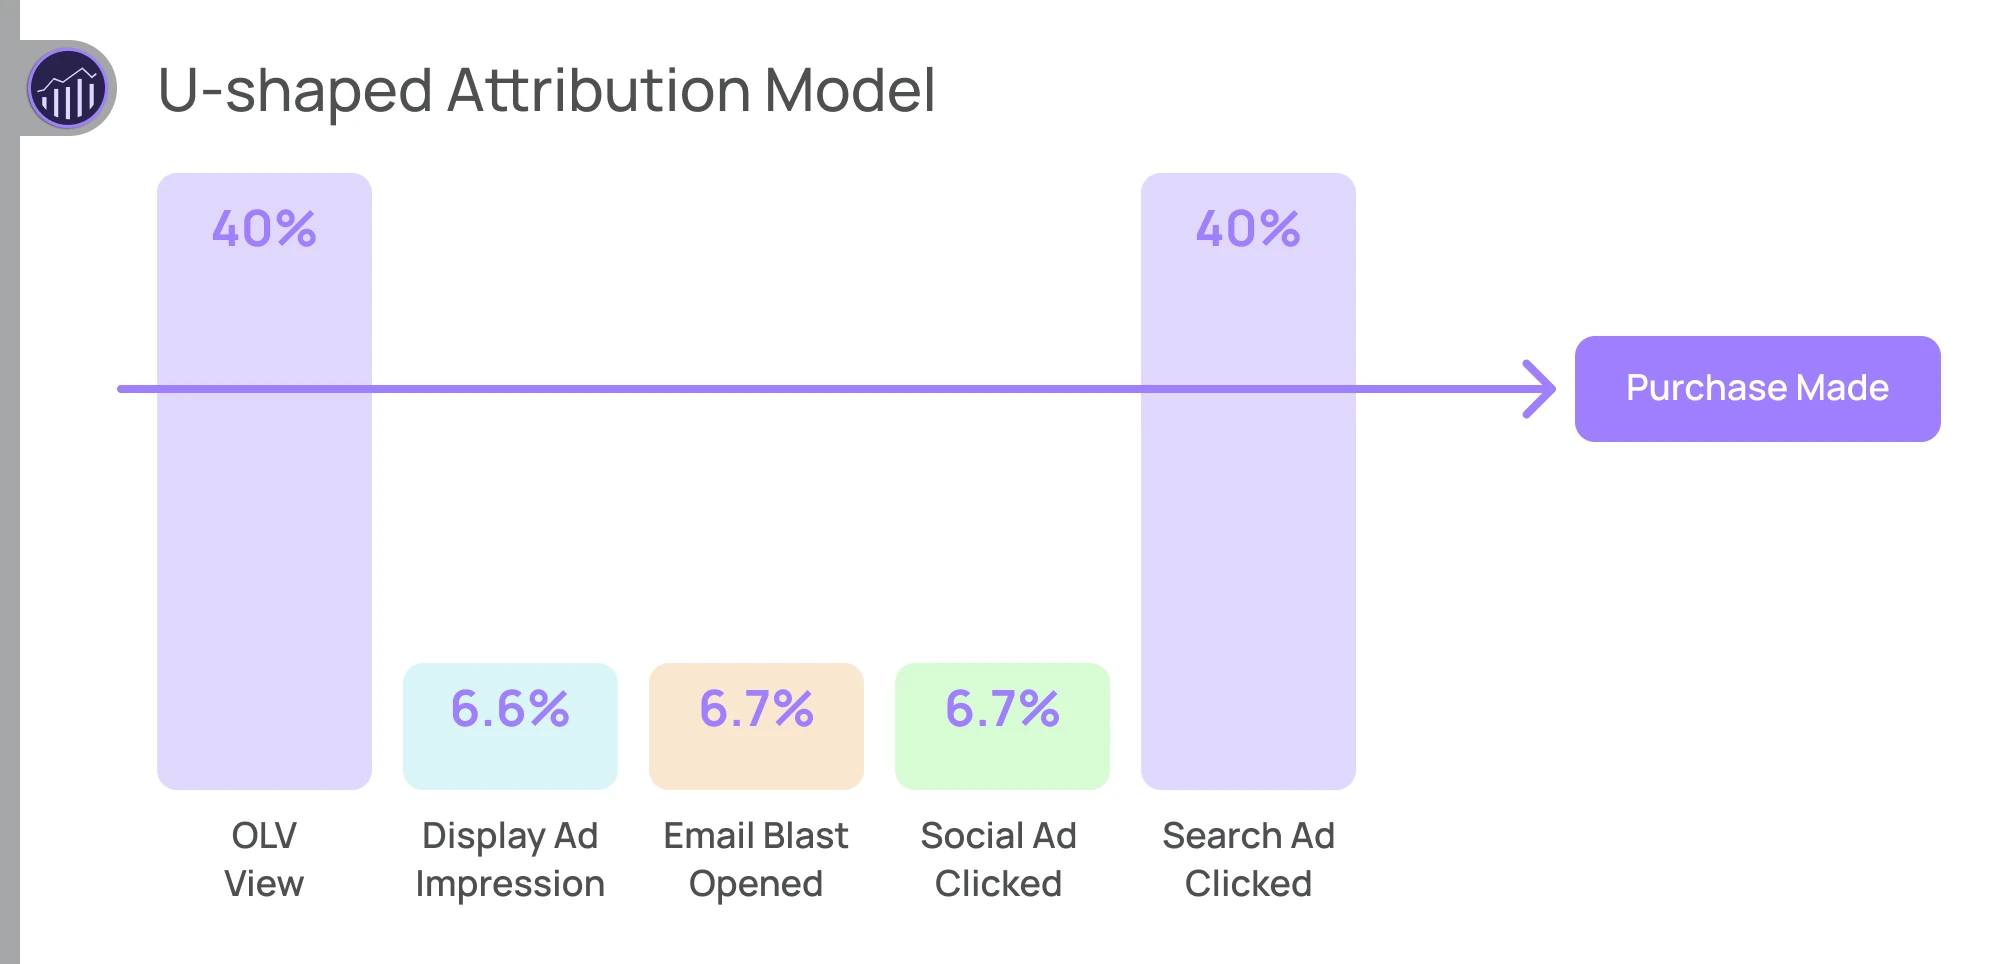
Attribution Models
As much as we’d like all customers to make an impulse buy after seeing just one ad, or getting just one email, most of them won’t. So, getting visibility on all the touchpoints that led up to a purchase or a lead is vital to understanding the customer journey as a whole.
Adobe Analytics has a large list of attribution models that make it easy to appropriately analyze data and assign credit to touchpoints at different funnel stages.
Here are some of the attribution models currently available:
- Same touch: 100% of the credit goes to the touchpoint on which the conversion happened.
- First touch: Gives the most credit to the first touchpoint leading up to the conversion.
- Last touch: Gives the most credit to the last touchpoint before the conversion.
- U-Shaped: Gives 40% of the credit to the first and last touchpoints, and distributes the remaining 20% among all touchpoints in the middle.
- Algorithmic: Leverages statistical modeling to assign credit across the dimensions in your Adobe Analytics dashboard.
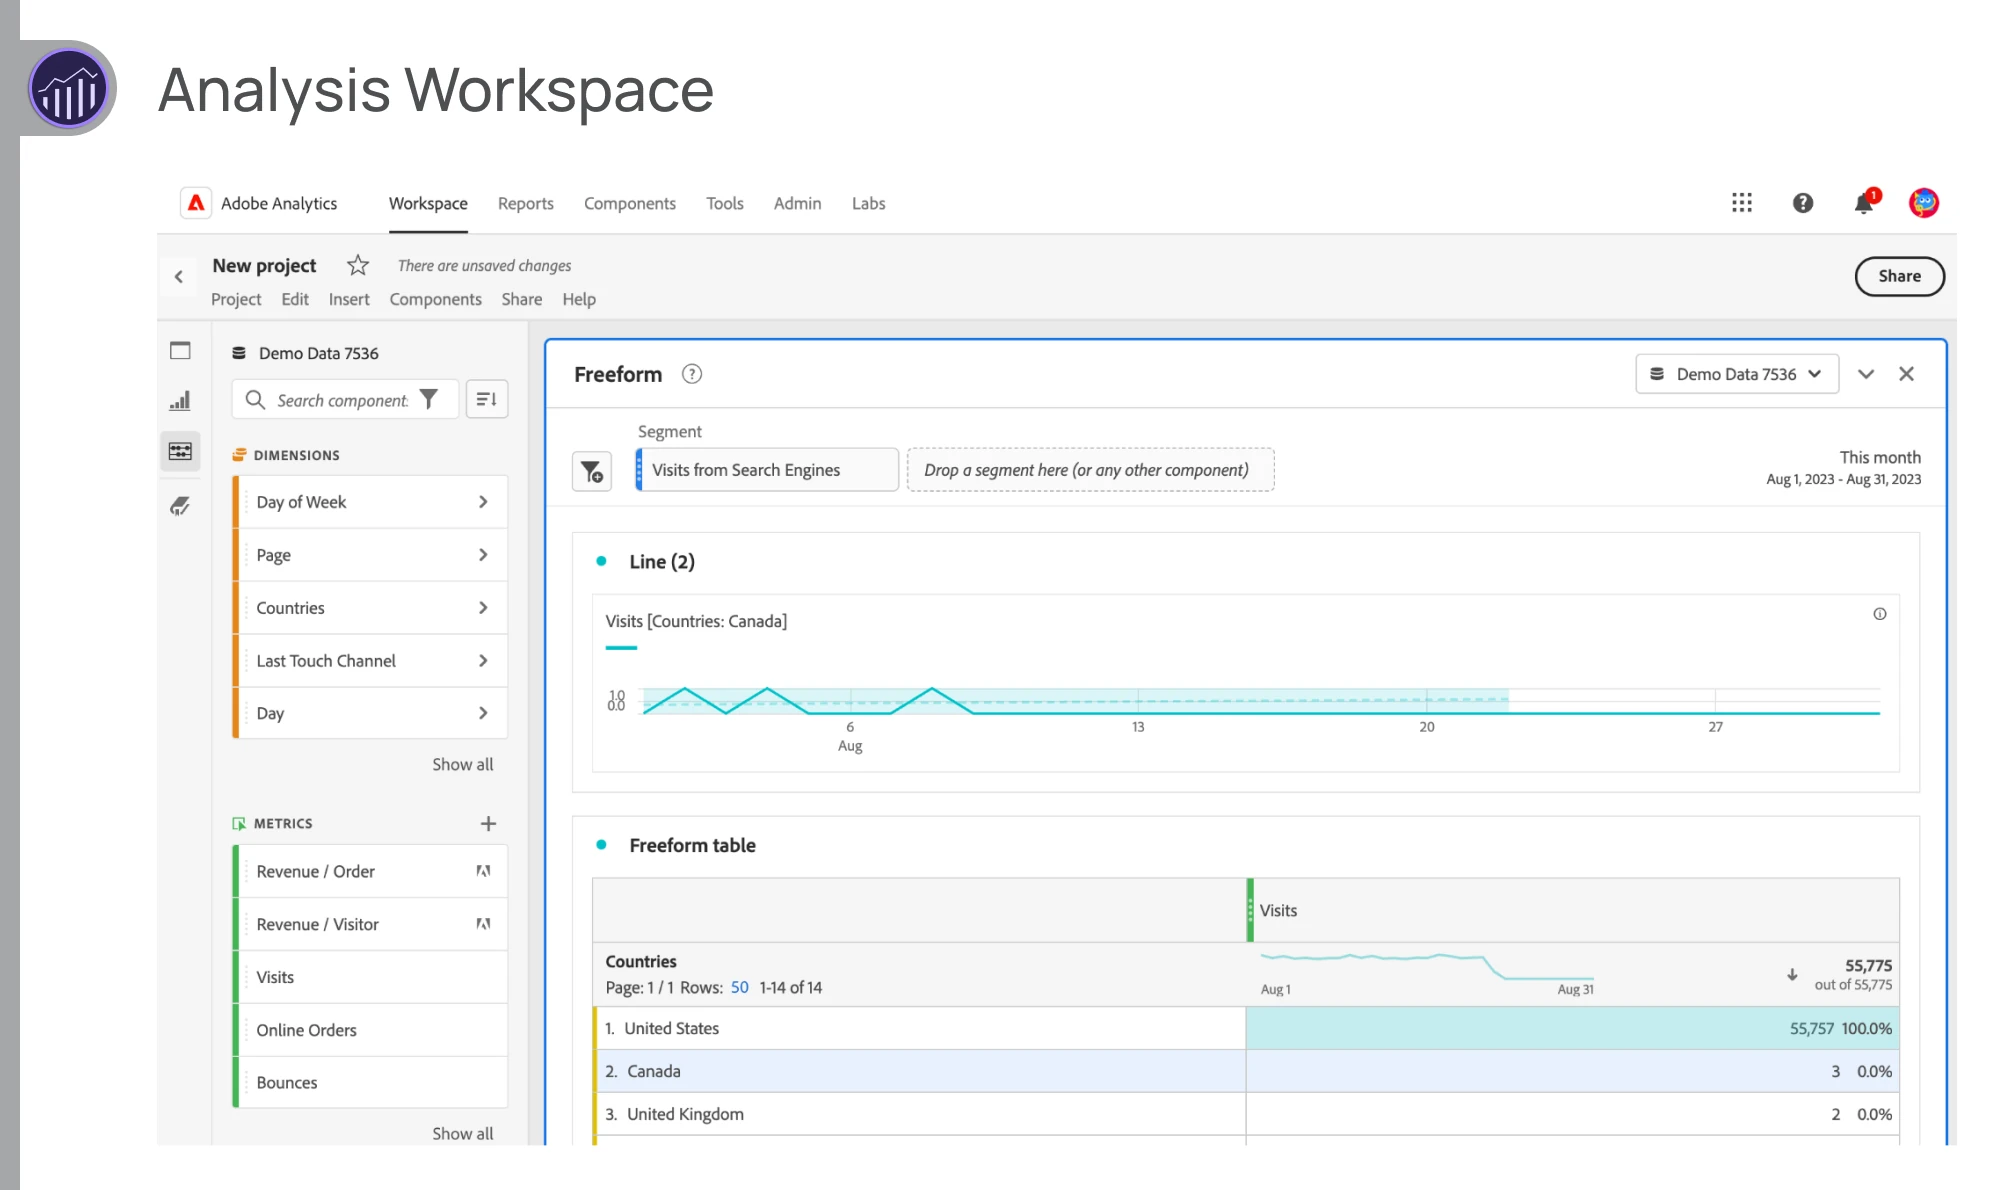
Analytics Workspace
Until recently, analytics reports were built within Adobe Reports and Analytics. But, in order to meet evolving analytics needs and make reporting more accessible, Adobe decided to sunset Reports and Analytics in favor of Analytics Workspace, which has already inherited many of its predecessors’ main features.
In Analytics Workspace, you can customize what data you need to see and compare and tailor your data visualizations to paint the most accurate picture of your analysis. Adobe Analytics Analysis Workspace reports are organized into panels that will contain visualizations of your metrics and segments.
Here are some of the many visualizations you can use to explain your data:
- Flow charts
- Bar graphs
- Donuts
- Histograms
- Line graphs
- Maps
- Fallouts
- Venns
The best part? You don’t need to have a background in building data dashboards to make the most out of this feature. You can start with a template, and then simply drag and drop components into your reports with Adobe ad hoc analysis.
After that, you can share your dashboards with anyone that needs to see them, whether they’re in your organization, or outside of it.
Components of Adobe Analytics
You might be wondering whether Adobe Analytics has everything you need to view and analyze your data in the most relevant ways to you.
Most businesses want to invest in analytics software that can accommodate growing and evolving data needs—enabling reporting on almost any dataset you have, in almost any way you can think of.
Good news: This is what Adobe Analytics does best. Within your panels and visualizations, five powerful components in Adobe Analytics give you a near-limitless number of ways to analyze and report on your data:
Date Ranges: The specific time period during which your data was collected. For example, you might want to look at data collected in the last 30 days.
- Dimensions: Descriptions of user activity, like the name of the page they visited, or the marketing channel they arrived through.
- Dimension Items: Further breakdowns of dimensions. For example, if you’re looking at the marketing channel dimension, some dimension items might be paid search, paid social, or OLV.
- Segments: Filters that you can apply to your visitor data, to view only certain visitor traits or aspects. For example, users who arrived on your site from a mobile device.
- Metrics: Behaviors or actions that your visitors complete. For example, orders, video views, page views, or time spent on site.
Insights and automation with AI
Because the marketing landscape is constantly changing, it can be hard for marketers to identify the reasons why their data is…how it is. And when you’ve got rivers of data flowing in all the time, it can be tough to catch anomalies that could lead to valuable strategic learnings.
Adobe Analytics harnesses the power of Adobe’s powerful AI, Sensei, to help detect data anomalies and alert you. Not only that, it employs Contribution Analysis to explain why those anomalies occurred based on patterns hiding deep within your data.
Conclusion
If data is your thing (and for most marketers, it is), then you’re going to need robust analytics software that thoroughly informs and inspires action around your customer journey.
By now, you should have a solid idea of how Adobe Analytics rises a step above other analytics platforms by providing robust insights, extensive integrations, and industry-leading reporting.
Whether you’re just getting started on your analytics journey, or whether you’re swimming in a wild sea of data, Adobe Analytics is accessible enough and robust enough to turn your data into a goldmine.
Now, we get it—this might sound like a dream platform to data lovers everywhere. But if getting started feels like an obstacle you’re not sure how to overcome, don’t worry. Our Adobe Analytics masters are here to support you!
FAQ:
What is the difference between Adobe and Google Analytics?
Some of the key differences between Adobe Analytics and Google Analytics are:
- Google Analytics has a free version, and Adobe Analytics doesn’t.
- Google Analytics is easier to implement and simpler for beginners, whereas Adobe
- Analytics is harder to implement but more customizable and granular.
- Adobe Analytics retains data much longer than Google Analytics.
How does Adobe Analytics track data?
Adobe Analytics tracks data via a data collection code placed on your website or app, or via integrations with 200+ other platforms.
What can you measure with Adobe Analytics?
Adobe Analytics enables you to measure all aspects of your customer’s journey, including:
- What actions they’ve completed, like a purchase (metrics).
- What attributes they share, like the device they visited on (segments).
- Descriptions of their activities, like pages they viewed (dimensions).
What are the disadvantages of Adobe Analytics?
Some of the disadvantages of Adobe Analytics are:
- Implementation is more technically complicated and may require professional support.
- It’s a paid platform, whereas some other competitors are free to use.
- Technical troubleshooting support through Adobe isn’t always as helpful for beginners.
Does Adobe Analytics provide real-time data?
Yes, Adobe Analytics provides real-time data via its Live Stream feature.
Does Adobe Analytics use cookies to track website user activity?
Yes, Adobe Analytics uses first and third-party cookies to track user activity. Additionally, due to the large-scale prevention of third-party cookie tracking, Adobe provides the following additional measures to more responsibly and accurately track user activity:
- Server-side data collection.
- Web SDK’s First Party Device ID (FPID).
- Hashed logins through Customer Journey Analytics and Cross-Device Analytics.